


Bitcoin is (Still) a Demographic Mega-trend: Data Update
Every 18 months our team at Blockchain Capital commissions The Harris Poll to conduct a nationwide online survey of over 2,000 US adults to gauge the progression of the US general population through the crypto adoption funnel.
We first worked with The Harris Poll on this survey in Fall 2017 then ran it again 18 months later in Spring 2019. You can review the data results and analysis from the Spring 2019 survey here.
Most recently, we commissioned this survey October 7–9, 2020. This post will review those results. These days, there are dozens of crypto-related surveys from various providers — What differentiates the results we share here is two things:
- Meaningful Comparisons: We’ve been running the same survey for over three years so that we can draw meaningful conclusions from survey-over-survey results. We add a couple questions to each subsequent survey but the wording of existing questions remains identical.
- Neutral third-party: The Harris Poll conducts the survey (on our behalf) because if we did it ourselves the results would naturally be skewed in favor of crypto-friendly audiences.
This survey is intended to gauge the general population’s awareness, familiarity, perception, conviction, relative preference rates and propensity to purchase crypto. We can visualize each of these items as components of the crypto adoption funnel(depicted below):

As depicted below, we break down the crypto adoption funnel into three major phases: the ‘learning phase’, the ‘conviction phase’ and the ‘adoption phase’.

In terms of high-level takeaways what’s most notable is that from Fall 2017 to Spring 2019 we saw the strongest growth in the “learning phase” of the adoption funnel. In contrast, in the most recent survey we saw the strongest growth in the “conviction phase” of the funnel. The general population does indeed appear to be progressing through the crypto adoption funnel — and at a rapid clip to boot.
If you’re short on time and don’t want to dig through the charts below, here’s a few highlights:

Let’s jump into the results and walk through the adoption funnel.
“Learning phase”: awareness, familiarity, perception

As with most of the metrics in the “learning phase” of the adoption funnel, we saw moderate growth in the most recent survey but awareness is relatively saturated at this point as most people (90%) have heard of Bitcoin. This is the only question in the survey that does not have a heavy age skew — regardless of age, most Americans have heard of Bitcoin.

Similar to awareness, we observed moderate growth in terms of the general population’s familiarity with Bitcoin but it too has somewhat leveled off — the percentage of people that are ‘at least somewhat familiar’ with Bitcoin rose from 43% in Spring 2019 to 45% in Fall 2020. The age skew in 2020 is pronounced here with 60% of those aged 18–34 describing themselves as ‘at least somewhat familiar’ with Bitcoin — compared to just 24% of those aged over 65 years.

The percentage of people whom ‘strongly’ or ‘somewhat’ agree that ‘Bitcoin is a positive innovation in financial technology’ also rose 2 percentage points — from 43% in Spring 2019 to 45% in Fall 2020. Younger demographics remain most inclined to having a positive view of Bitcoin: 60% of those aged 18–34 (up 12 percentage points from Fall 2017) and 58% of those aged 35–44 ‘strongly’ or ‘somewhat’ agree that ‘Bitcoin is a positive innovation in financial technology’ — compared to just 33% of those ages 45+.
“Conviction phase”: Conviction, preference rates and purchase propensity
The strongest growth in the Fall 2020 survey results was in the conviction phase of the funnel. Our team expected to see strong growth here, but the results drastically exceeded even our own expectations.

One way that we gauge conviction is by asking to what extent do you agree or disagree with the statement that ‘most people will be using Bitcoin in the next 10 years’? The percentage of people that ‘strongly’ or ‘somewhat’ agree with this statement rose 8 percentage points from 33% in Spring 2019 to 41% in Fall 2020 — including 56% of those aged 18–34 and 57% of those aged 35–44.

For fun, we added a new question to the Fall 2020 survey asking Americans whether they expect the euro or Bitcoin to exist longer. In total 38% of people expect Bitcoin to exist longer than the euro — including 58% of those aged 18–34.

Aside from conviction in Bitcoin’s future, we also try to gauge the general population’s preference rates for Bitcoin relative to other assets they may choose to invest in. So we ask, whether they would prefer to own $1,000 of Bitcoin over $1,000 of [government bonds / stocks / real estate /gold]. Preference rates for bitcoin were up across the board — with particularly strong growth among younger demographics.
Among the total population: 26% prefer bitcoin to government bonds (up from 21% in Spring 2019), 23% prefer bitcoin to stocks (up from 17% in Spring 2019), 20% prefer bitcoin to real estate (up from 14% in Spring 2019), and 18% prefer bitcoin to gold (up from 12% in Spring 2019).
Among those aged 18–34: 38% prefer bitcoin to government bonds (up from 30% in Spring 2019), 35% prefer bitcoin to stocks (up from 27% in Spring 2019), 33% prefer bitcoin to real estate (up from 24% in Spring 2019), and 31% prefer bitcoin to gold (up from 22% in Spring 2019).
Among those aged 35–44: 36% prefer bitcoin to government bonds (up from 27% in Spring 2019), 31% prefer bitcoin to stocks (up from 22% in Spring 2019), 25% prefer bitcoin to real estate (up from 15% in Spring 2019), and 26% prefer bitcoin to gold (up from 14% in Spring 2019).

Despite the fact that the time of the survey the price of Bitcoin was still roughly 50% below its all-time-high, we saw a surge in the general population’s propensity to purchase bitcoin. In total, the percentage of people that indicated they are ‘very’ or ‘somewhat’ likely to buy Bitcoin in the next 5 years rose 7 percentage points — from 27% in Spring 2019 to 34% in Fall 2020.
Consistent with other questions in the survey, younger demographics appear most inclined to purchase Bitcoin: 55% of those aged 18–34 (up 13 percentage points from 42% in Spring 2019) said they are ‘very’ or ‘somewhat’ likely to purchase Bitcoin in the next 5 years — compared to 26% of those aged 35+.
“Adoption Phase”: Owners and users
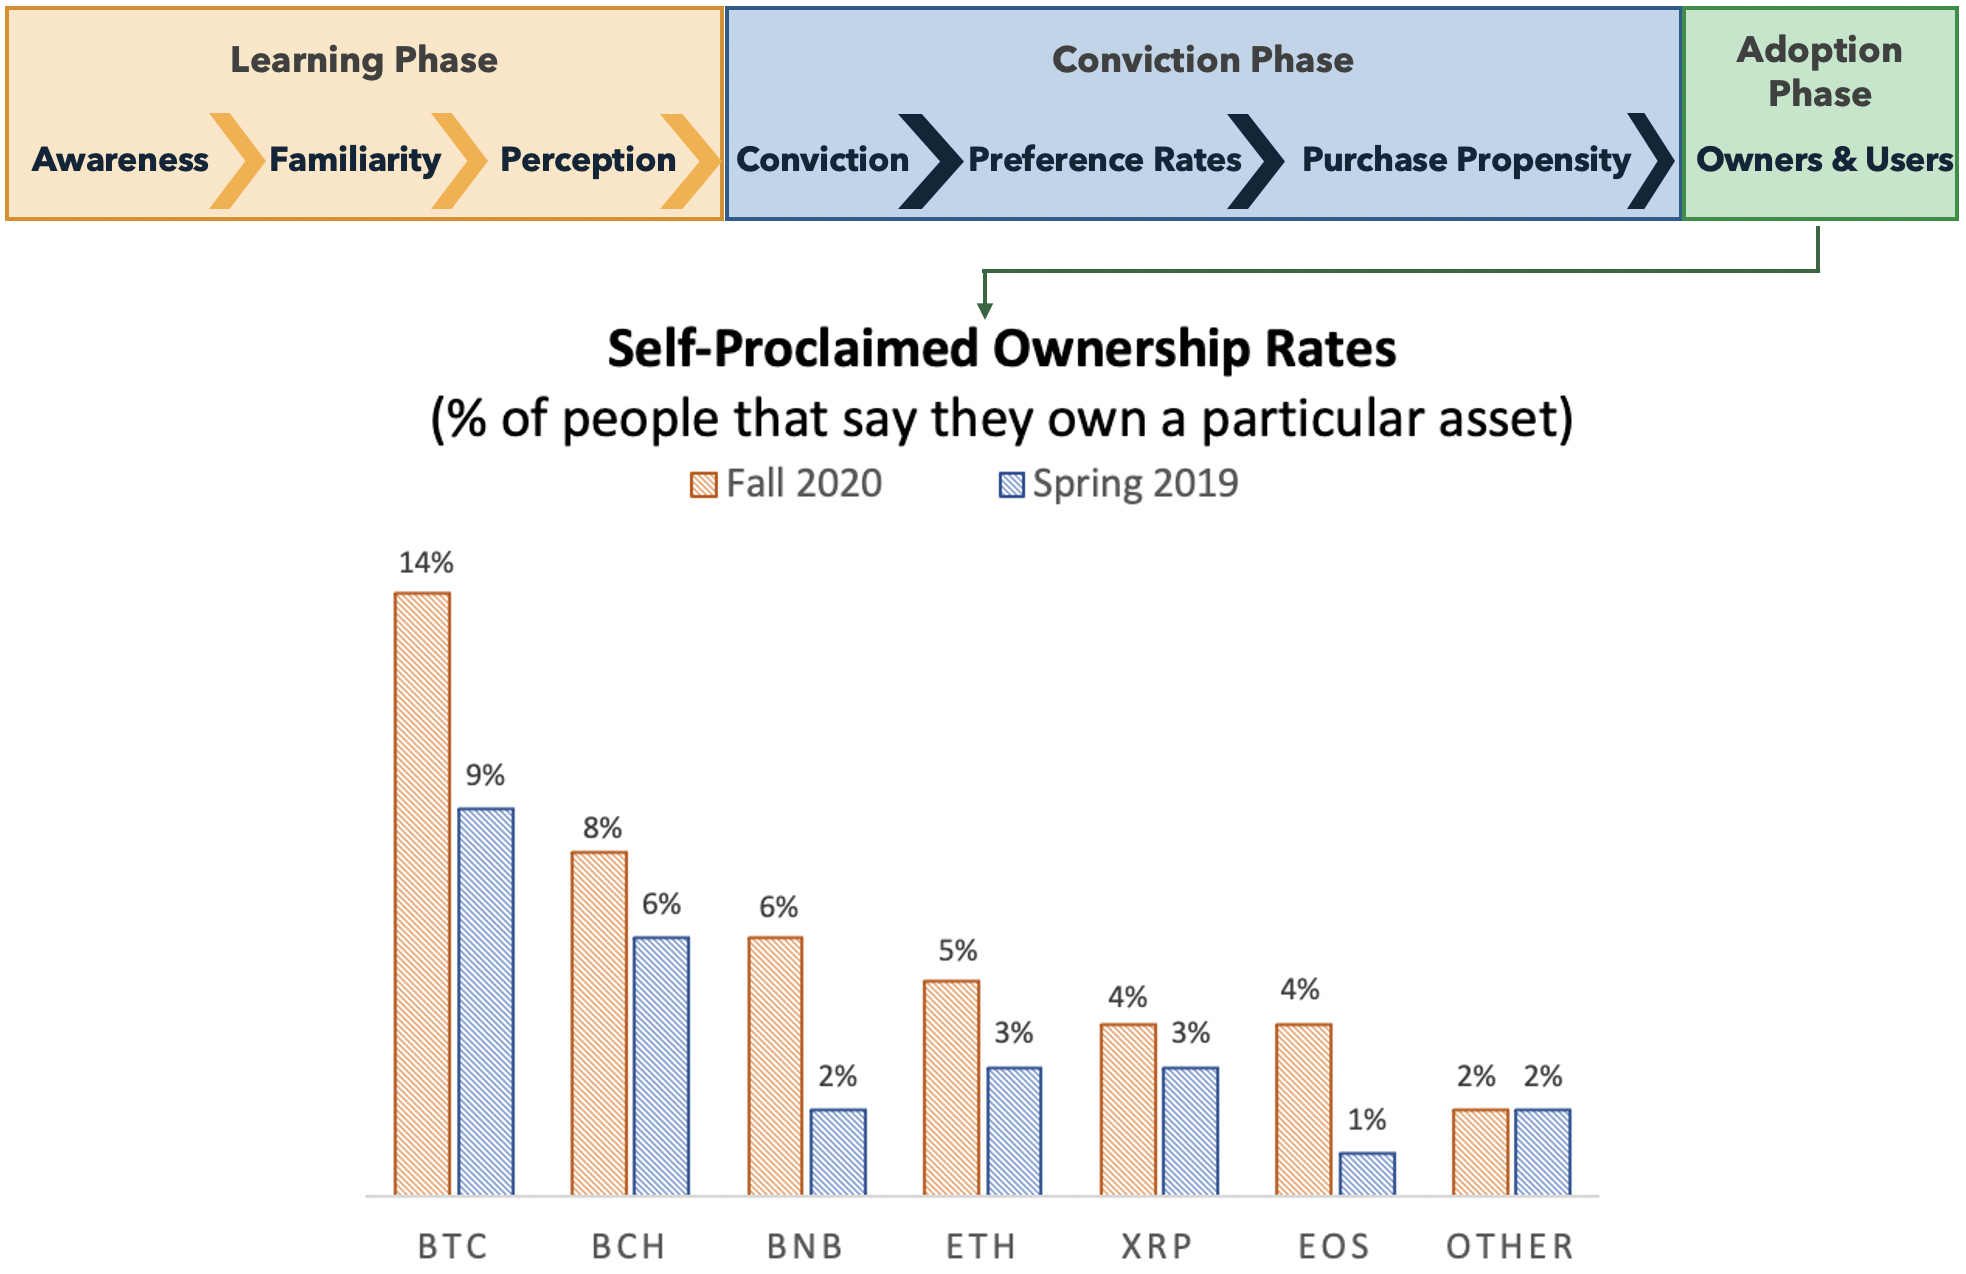
Crypto ownership is increasing across the board (24% in Fall 2020 vs. 16% in Spring 2019). Among those who have at least heard of any crypto-asset, Bitcoin has the broadest ownership in Fall 2020 with 14% claiming that they own Bitcoin. In comparison, 8% say they own Bitcoin Cash, 6% claim to own BNB, and 5% claim to own Ether.
Conclusion
The most notable takeaway from this data is that bitcoin has two very significant tailwinds from the passage of time.
First, as Bitcoin proves itself year-over-year, the general population — regardless of age — seems to be progressing through the adoption funnel.
Second, with the passage of time, currently younger demographics comprise a larger portion of aggregate economic and investment activity — which is particularly notable given that younger demographics are drastically more inclined to buy and use bitcoin than older demographics.
Ultimately, technology (and macro) investors have long focused on the interests, engagement, and activities of younger segments of the population as a window to the future. In the case of bitcoin (and crypto more broadly), the indicators are evident. The question is: Will forward-looking companies and investors position accordingly?
Disclosures: Blockchain Capital is an investor in several of the protocols mentioned above. The views expressed in each blog post may be the personal views of each author and do not necessarily reflect the views of Blockchain Capital and its affiliates. Neither Blockchain Capital nor the author guarantees the accuracy, adequacy or completeness of information provided in each blog post. No representation or warranty, express or implied, is made or given by or on behalf of Blockchain Capital, the author or any other person as to the accuracy and completeness or fairness of the information contained in any blog post and no responsibility or liability is accepted for any such information. Nothing contained in each blog post constitutes investment, regulatory, legal, compliance or tax or other advice nor is it to be relied on in making an investment decision. Blog posts should not be viewed as current or past recommendations or solicitations of an offer to buy or sell any securities or to adopt any investment strategy. The blog posts may contain projections or other forward-looking statements, which are based on beliefs, assumptions and expectations that may change as a result of many possible events or factors. If a change occurs, actual results may vary materially from those expressed in the forward-looking statements. All forward-looking statements speak only as of the date such statements are made, and neither Blockchain Capital nor each author assumes any duty to update such statements except as required by law. To the extent that any documents, presentations or other materials produced, published or otherwise distributed by Blockchain Capital are referenced in any blog post, such materials should be read with careful attention to any disclaimers provided therein.
Survey Methodology:
These surveys were conducted online within the United States between October 7–9, 2020 among 2022 U.S. adults aged 18 and over, April 23–25,2019 among 2029 U.S. adults aged 18 and over, and October 18–20, 2017 among 2112 U.S. adults aged 18 and over, by The Harris Poll on behalf of Blockchain Capital via its Harris On Demand omnibus product. Figures for age, sex, race/ethnicity, education, region and household income were weighted where necessary to bring them into line with their actual proportions in the population. Propensity score weighting was used to adjust for respondents’ propensity to be online.
All sample surveys and polls, whether or not they use probability sampling, are subject to multiple sources of error which are most often not possible to quantify or estimate, including sampling error, coverage error, error associated with nonresponse, error associated with question wording and response options, and post-survey weighting and adjustments. Therefore, the words “margin of error” are avoided as they are misleading. All that can be calculated are different possible sampling errors with different probabilities for pure, unweighted, random samples with 100% response rates. These are only theoretical because no published polls come close to this ideal.
Respondents for this survey were selected from among those who have agreed to participate in our surveys. The data have been weighted to reflect the composition of the adult population. Because the sample is based on those who agreed to participate in the online panel, no estimates of theoretical sampling error can be calculated.
For further information on the survey, please reach out at Contact@BlockchainCapital.com


No Results Found.